Governing based on misleading stereotypes? Who'd have thought it!
Hardly any independent schools fit the "Eton/Harrow" stereotype; and hardly any parents are millionaires. I review the facts.
The Guardian’s coverage of independent schools almost always features pictures of Eton, Eton, Harrow, Harrow, Eton, Winchester, Winchester, Dulwich, and Eton again. What the hell, it’s the Guardian. The Telegraph is no better, with Eton, Eton, Eton, Harrow, Eton, Eton, Eton, Clifton, and Eton.
Casual readers might think there are only two types of schools and two types of family:
Independent schools: Palatial, with billion-pound endowments, gold-plated swimming pools and caviar for breakfast. Everyone’s dad is a non-dom billionaire who does £50k/year school fees as casually as he does a £50k/week yacht charter.
State or maintained schools: Decrepit sheds with no roof, where all children are starving and there’s 1 maths teacher between 740 children, and the non-dom-billionaire types have (somehow) done this on purpose.
It’s certainly the stereotype Bridget Phillipson likes to play on when she’s not reprising her version of the Four Yorkshiremen. “Unsurprisingly, private school attendance is largely concentrated at the very top of the income distribution,” she told the New Statesman which featured, on this occasion, a picture of Bridget Phillipson instead of Eton, Eton, Winchester, or Eton. Private schools are “for the privileged few” she told the BBC (which, to my pleasant surprise, tends to feature pictures of teachers and children at a range of schools).
Does Phillipson believe this? She’s not lazy or stupid (I’ll resist the temptation of other adjectives). Is she, therefore, deliberately playing voters for fools with her oppressor / oppressed tale? Bully and victim? We could call this cultural Marxism. We could just call it Marxism. Capitalist and proletariat. Corbyn’s tax, remember?
Today’s post looks at some actual data. Let’s all make the most of objectivity before (on Phillipson’s watch) academic “educationists” go ahead and “debunk the myth of objectivity” and also while (on Phillipson’s watch) we can still freely speak of it. We’ll see (and you might be as shocked as I was) just how bad Phillipson’s stereotypes are, and I hope to persuade you that demolishing them is a necessary step to tearing down this stupid policy.
Diversity in independent schools
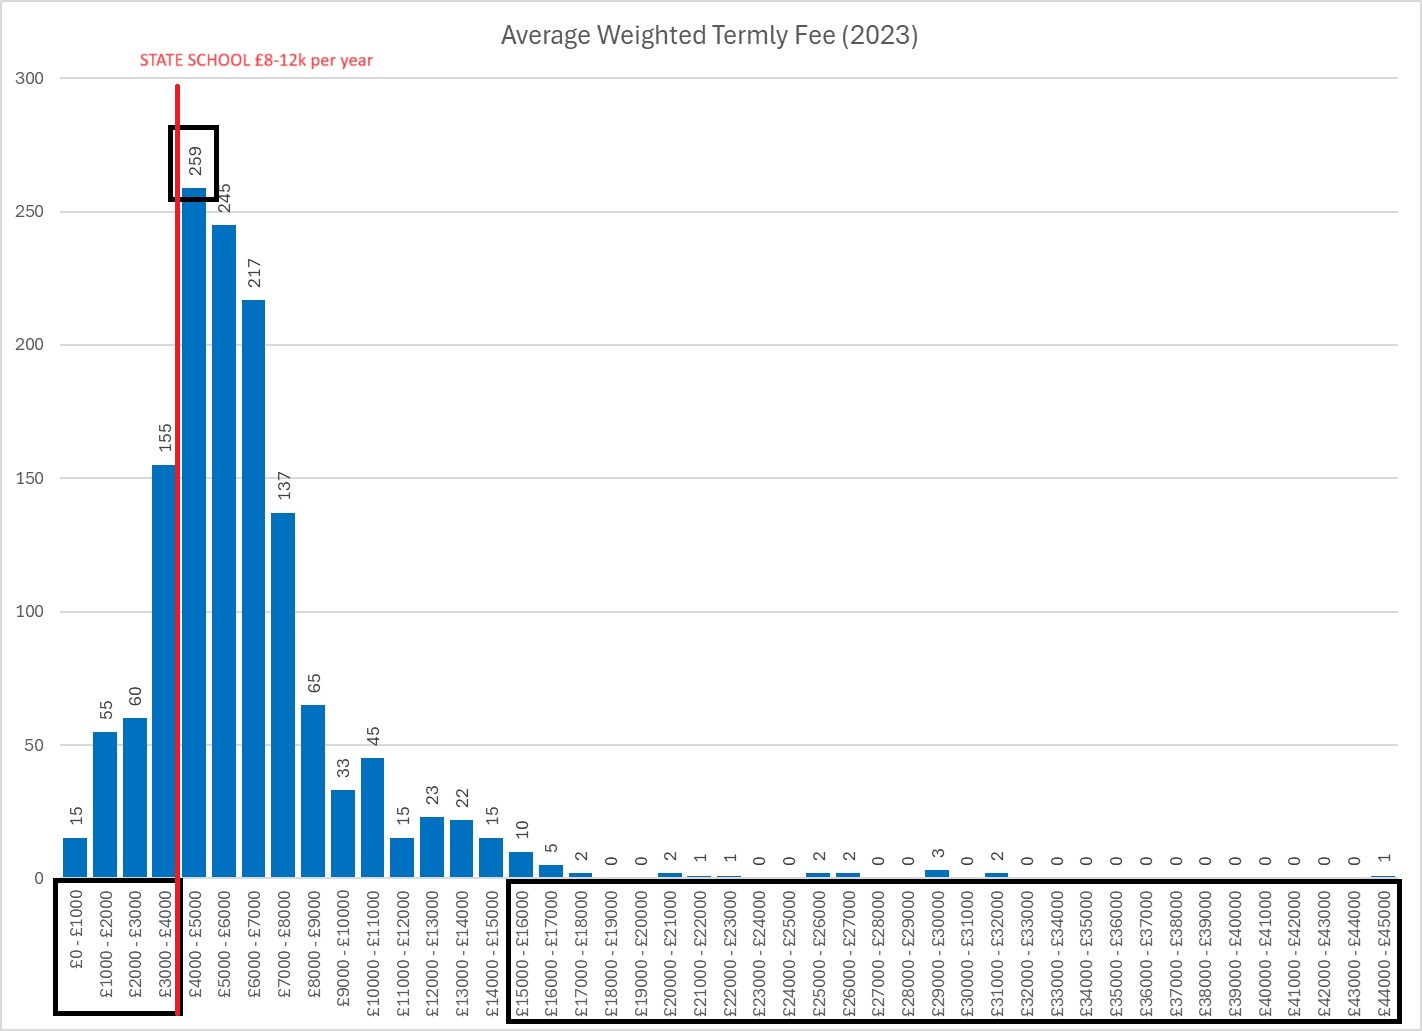
Here’s a histogram using 2023 data from the Independent Schools Council showing the distribution of termly fees for 1400 of their members. The slightly clumsy markups are mine, with the vertical red line showing the state school expense to taxpayers of £8-12k a year per child. That’s £8k for variable costs including state schools’ very special £400k input VAT tax break (yes, actually so) plus £3-4k for fixed costs and overheads according to Oxford Economics.
So 285 schools (20% of the sample) charge less than the fully-loaded cost of state school. 130 schools (9%) charge less even than the variable cost. Some “privilege”. Those proportions are probably an underestimate, as ISC membership is skewed towards the larger schools; these smaller, more affordable schools are more likely to be in the Independent Schools Association, or no association at all.
The “modal” point on the histogram indicates 504 schools (36%, adding the 259 and the 245 columns) charging up to 50% more than the £12k fully-loaded cost of state schools. More, but not spectacularly so, and remember that those fees also cover charitable activities like bursaries and partnerships.
Only 31 schools (2%) are charging >£45k a year; those will be almost entirely
specialist schools for children with the most severe Special Educational Needs
top boarding schools, which should not be compared to maintained day schools (£8-12k a year) but to state boarding schools (fees average £14k a year, up to £20k, plus the
freestate-funded teaching expense of, again, £8-12k, so £26k all-in).
State boarding schools will, of course, remain VAT-exempt because
if you can afford state boarding fees up to £20k, with the actual teaching provided
freeat taxpayers’ expense, you’re in the “oppressed” group, but if you can afford independent day school for a similar price, or much less, you’re an “oppressor” and that’s the way it is, see?state boarding for a cost of £14-20k is completely different to independent school boarding for a cost of (based on schools that are mixed day/boarding)….wait for it… £14-20k, so never mind “fiscal neutrality”, they’re just saying “state good, independent bad”…and that’s also the way it is. Perfect sense.
Diversity in state schools
It’s less of a surprise (you’d think) that there’s diversity in state schools. To remind everyone, the Education Not Taxation campaign supports state schools (literally, by paying taxes and not demanding the non-existent unfunded places we’re entitled to, but also politically, regardless of party, in encouraging sensible policies to make state schools better). We just want good schools, as many children as possible going to good schools.
on the upside, there are flourishing state schools with great results to match the best of the private sector; there are grammar schools; there are catchment areas with house prices to match, and all of these are coming under increased pressure as a result of Corbyn’s Education Tax, making these schools less effective instruments of social mobility.
there are satisfactory and good academies and comprehensives that probably do OK for many/most/all of their pupils.
and finally on the downside, of course, there are schools that struggle not only with outcomes, but with pupil behaviour, absenteeism, parental engagement, teacher morale and retention.
Diversity in parents’ choices
The best coverage of demand-side diversity in both sectors I have read is in this blog from Diarmid Mackenzie, who explores the nature of the 6.5% of children attending independent schools.
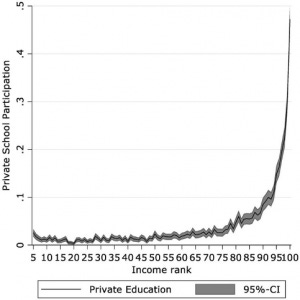
Mackenzie starts with UCL data on incomes of independent school households (from a sample population of households with children age 5-15) which was hailed as PROVING that RICH PEOPLE use independent schools SHOCK. “The proportion of children attending private school is close to zero across the vast majority of the income distribution” complain the authors, and “doesn’t rise above 10% of the cohort except among those with the top 5% of incomes” as shown in this chart:
It’s a woefully incompetent write-up from UCL. The proportion is “close to zero” across the income distribution for the very simple reason that 6.5% is close to zero. Where do they find these people?
Think of it instead like this: 6.5% is “par”. Most income segments are indeed “below par” at 1-3% of the segment - but that’s 15-45% of “par”, and 15-45% is a decent not-close-to-zero chunk. Independent schools are “below-par” in those segments, but by much less than I thought. It’s exactly “par” for the second decile, then >par in the top decile.
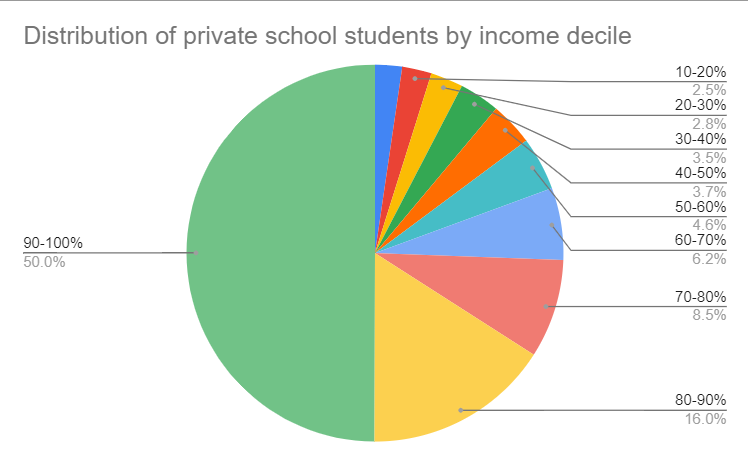
Mackenzie rightly points out that the UCL data supports far more interesting observations. Here’s his pie-chart, using the same data as the line graph:
Lots of the very rich (half of the top 1% households, by income) choose state schools. Also, well over half of the fairly-rich (top decile) choose state schools. The green chunk of pie above tells you that of the 6.5% of kids at independent school, half (3.25%) come from the top decile. That leaves 6.75 of every ten kids in the top decile at state school, although they could also presumably afford independent.
Lots of the not-particularly rich (second decile, down to median) choose independent schools. Actually, about 33% of the independent school population comes from these segments. So, by hook or by crook they can afford it. So, near anyone in those segments could afford it if they really want. Are these folks, to quote Phillipson again, “the very top of the income distribution”?
A decent chunk, around 16% of the independent school population come from the somewhat-poor (below median earnings), in many cases benefiting from bursaries and/or choosing the much more affordable schools on the left of the histogram up the page. Mackenzie rightly asks, why is nobody interested in these people? They are airbrushed out, an inconvenient truth against what we’ve now shown is Phillipson’s great deceit.
Are these “not-particularly-rich”, or even the “somewhat poor” not “working families”, who the Prime Minister promised would not be shouldering the extra tax burden? To quote Lord Hacking’s recent letter to the Prime Minister (I’ve attached it below, it’s a ripsnorter, worth reading in full):
The typical parent, as described to the author, would be a teacher and (say) a nurse with a joint household income of less than £50,000 - £60,000 per annum. Among the parents are cleaners, those working in hospitality and taxi drivers. Other parents are solicitors, accountants, engineers and medics. While there are some wealthy parents none appear to be from inherited wealth and are more likely to be successful businessmen and entrepreneurs. In every sense of the word the dominant feature of the parents of Bolton School falls under the description of ‘working people’.
Phillipson is even more wrong than MacKenzie thinks
As MacKenzie’s analysis reveals, Phillipson’s fallen for the UCL patter hook, line, and sinker:
Statistically, she is falling for the Flaw of Averages. The average income of independent school households, and the average fee level, are both dragged way up by the millionaire and Eton / severe SEN outliers. Averages mislead, like the the guy who drowns in a river that’s “on average” three feet deep. If you’re choosing whether to holiday in Norfolk or Holland, you’d better not “on average” choose the middle of the North Sea.
Empirically, Phillipson is plain wrong. Independent schools aren’t (only) for the “privileged few”, which to be generous I’ll call the top decile. They are clearly (also) for ~100,000 below-median-income kids, and ~200,000 median-to-second-decile kids.
What I can add:
Economically, Phillipson is doing even worse. Since the “Marginal Revolution” of the 1870s, economists have been taught that everything of significance is found at the margin. It’s irrelevant that families can, “on average”, be expected to pay the Education Tax. It’s not even relevant that “most” families will do so. In order to understand the effects of the tax on families and schools, in both sectors, the only analysis worth considering is the marginal analysis: how many families will stop being willing and able to pay fees+tax? Even if 75% of families were billionaires, all that matters is the actions of the 25%.
Where the Education Tax will fall and fail
Based on MacKenzie’s blog, and evidence from both state and independent schools, we can surely agree that wealthier / higher-earning people are buying better education in general.
But it’s not remotely true that it’s a “private school / state school” divide; or that the former are the sole preserve of the super-rich, or that the Education Tax is a simple redistribution from “the privileged few” who can and will pay the increased fees, or that all people in state schools are getting a terribly rough deal and can’t be asked to contribute to the education they receive for free.
The Education Tax can be expected to harm the following:
Marginal families and marginal schools:
Lower and middle-earners choosing the affordable private schools that already run on wafer-thin margins and cost less, or much less, to run than state schools; bastions of privilege, really?
Middle- and upper-earners just about managing fees for mid-tier schools, whose peers could equally afford the same provision but either (1) choose to spend their money on holidays and fast cars or (2) choose not to go the extra mile at work or (3) put their money into catchment areas and tutoring before arriving at Russell Group unis waving their “state-educated; under-privileged” badges;
Families on bursaries whose bursary provision is at-risk when schools seek, at the Government’s urging, to “cut their cloth”;
Families at schools that are at risk of closing
State school families
Families at already-crowded state schools in fully-subscribed areas, where displaced kids will be forced in. All collateral damage;
Families wanting a look, in future, at grammar schools / catchment areas / top sixth-form colleges, where geographic competition fuelled by displaced families promises to make them even more exclusive than they already are.
Displaced families will have to go somewhere, and it will cost money and harm other families, among the many ?unintended? consequences that severely undermine the “benefit” of spending the net tax revenue generated.
As the Education Not Taxation campaign punchline goes, it’s not too late to #FindABetterWay to improve state education, making it the responsibility of society instead of only trying to rinse the small chunk of people that already save state education £8-12k by paying our way from after-tax income. A good start would be to puncture the dodgy stereotypes.


What I find ironic in the UCL paper is that the source for their curve - another UCL paper co-authored by one Prof Green - ( found here: https://www.tandfonline.com/doi/full/10.1080/09645292.2021.1874878#d1e170 ) says (section 5.1):
"At the 100th percentile, about half of the children go to private school. At the 95th percentile, however, this proportion is much lower, with only 15 per cent of children in the private sector. While still much greater than the average, it is striking that only a minority of the affluent families in the top 5 per cent are paying for private education."
Emphasis on the last sentence. The obvious corollary being:
"While still slightly less than the average, it is striking that a significant majority of the affluent families in the top 5 per cent are benefiting from free state education."
Oops... sorry... my irony meter just pegged.....