
Laffer Loathing: my love/hate relationship with a napkin
Government sceptics must robustly reject socialist goals. We need to frame the debate so we assess the benefits of public spending against the full range of harms caused by high tax rates

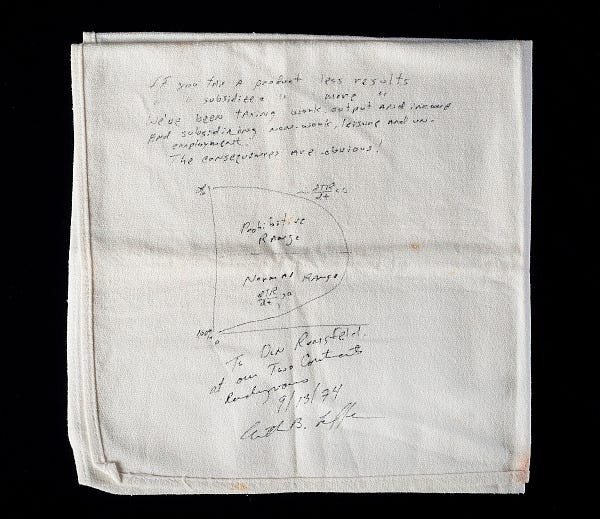
Art Laffer’s famous napkin is a terrific expression of something simple and true: increasing taxation discourages activity; at some point your tax revenue shrinks instead of growing. If the activity is something we’d really like more of, such as work or investment, this is a pretty bad show.
In the run-up to Rachel Reeves’ second “never-again” tax-raising Budget we’ll hear plenty about the Laffer Curve. We should think again: discussing the peak of the Laffer Curve is a curse as well as a blessing. We shouldn’t be interested in the peak. If we’re anywhere near Peak Laffer, we must scream blue murder and demand tax cuts.
Peak Laffer plays into the hands of the socialists, by accepting their zero valuation of the private sector. Far from “we’re all in it together, and the rich pay a bit more” we’re being taken towards what is, for me, terrifying: “there is no other role in society except paying taxes”. I explain why. This is a 10-minute read, or 5 minutes if you have a little economics background and prefer to cut the second half.
Love
The Laffer Curve is usually cited in favour of lower taxes and a smaller state. We show how some tax cuts can be self-financing and, more generally, tax cuts don’t lose as much government revenue as the arithmetic indicates. If raising tax rates means less revenue and less money for public services, it’s very hard for big-state advocates to maintain it’s a good idea.
It’s more normally shown in the form below. It’s easy to insist that the Laffer Curve exists; when some dotty socialists say otherwise, just ask them how much revenue a 100% tax rate would generate. As soon as they agree it’s zero, or near-zero, they’re agreeing with you, me and Laffer.
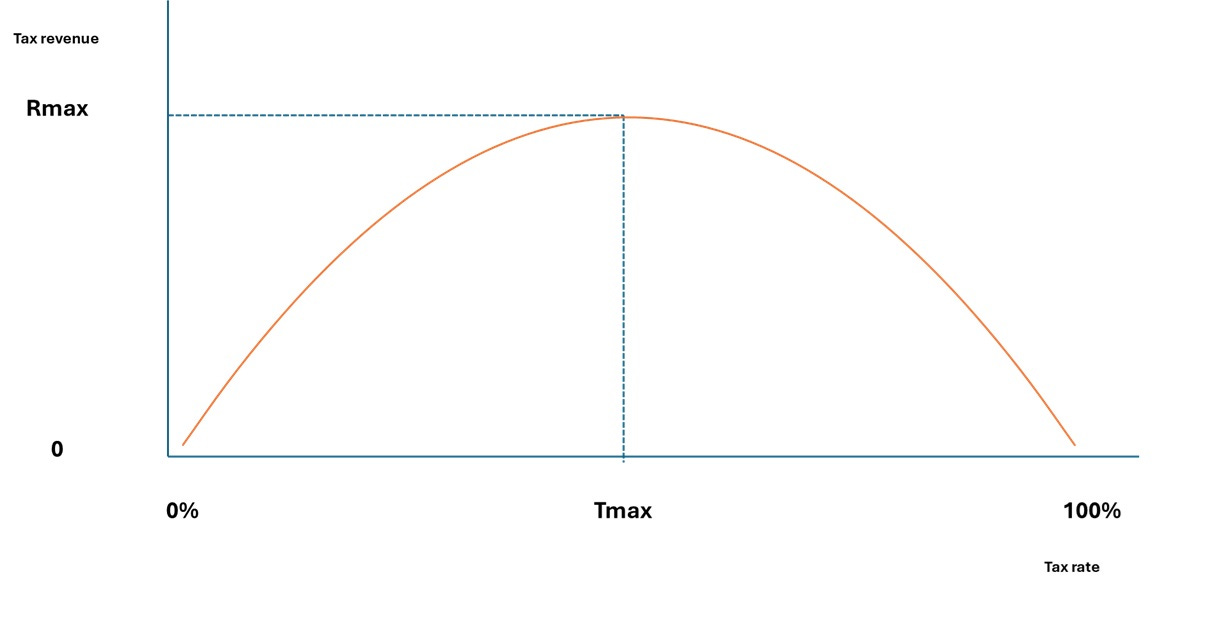
People debate the tax rate that is Tmax. As the Laffer Curve is typically drawn symmetrically, Tmax looks like 50%. But it could be 30%, or 75%, depending on human behaviour. Empirical evidence supposedly points to a rightwards skew with Tmax being between 50-70pc; I’m highly sceptical of such claims. It’s more reasonable to believe the Laffer Curve is left-skewed at, say, 30-50pc for six main reasons:
Studies only focus on short-term behaviour, not long-term; in the long run, people are more likely to change behaviour, and future generations are less likely to adopt the behaviour in the first place;
Studies only measure revenue raised (or not raised) by a particular tax; they don’t account for the indirect effects on revenue from other taxes;
Both 1 and 2 act in concert. Long run behavioural response is more likely to spread across more behaviours and affect more types of taxable activity;
All of 1-3 are subject to unseen counterfactual losses - you can measure tax receipts and changes in tax receipts, you can’t measure the new activity that might have happened, but didn’t;
Studies fail to take into account the deadweight loss of tax collection, enforcement, compliance and avoidance activity, which increase with tax rates;
I have my doubts about the integrity and bias of taxpayer-funded economists working in left-leaning think-tanks and academia; naturally anyone can feel free to level the opposite criticism at me.
For a more formal review, try this, which says the peak is both lower and further to the left than most empirical reviews indicate:
The standard approach to evaluate the Laffer curve of personal income taxation focuses on the impact on income tax revenue alone. However, this is an incomplete depiction of reality, as income tax rate changes also affect revenue collection from other taxes -i.e. consumption taxes and social security contributions. In addition, to the extent that administration and compliance costs correlate with tax rates, the Laffer curve should also consider this correlation….results confirm that these omissions generate the false illusion of a Laffer curve with a higher-than-real revenue maximum and a narrower prohibitive zone than exists in reality.
Regardless, I love the Laffer Curve because it shows that raising taxes has limits.
Hate
The great risk, and the subject of this article, is that by quibbling about “where the heck is Tmax?", we’re legitimising Tmax as our goal. “Then we can raise maximum revenue!” That’s a goal that suits our socialist opponents beautifully, that places zero valuation on the private sector. Knowing better, we have to change the framing of the discussion.
Economics is not the study of “maximising the size of government”. It is the study of balancing costs and benefits so humans can meet our various wants and needs; and to paraphrase Bastiat, good economists are interested in all costs and all benefits.
One of the few economists I’m aware of who rightly insists that Tmax is too high, is Dan Mitchell at the Cato Institute. His blog is well worth following; in this particular column, he says “The goal should be to set tax rates at the growth-maximizing level (raising the small amount of revenue needed to finance the legitimate and proper functions of government).”
“Growth-maximising” is correct if growth is the only objective. In the same way “revenue-maximising” is correct if revenue is the only objective.
Actually, our objective is to balance (1) the benefits of household consumption, saving and investment with (2) the benefits of government spending “investment” and (actually, sometimes) investment, in context of (3) funding the latter using taxes extracted on threat of violence “asked for” from the former.
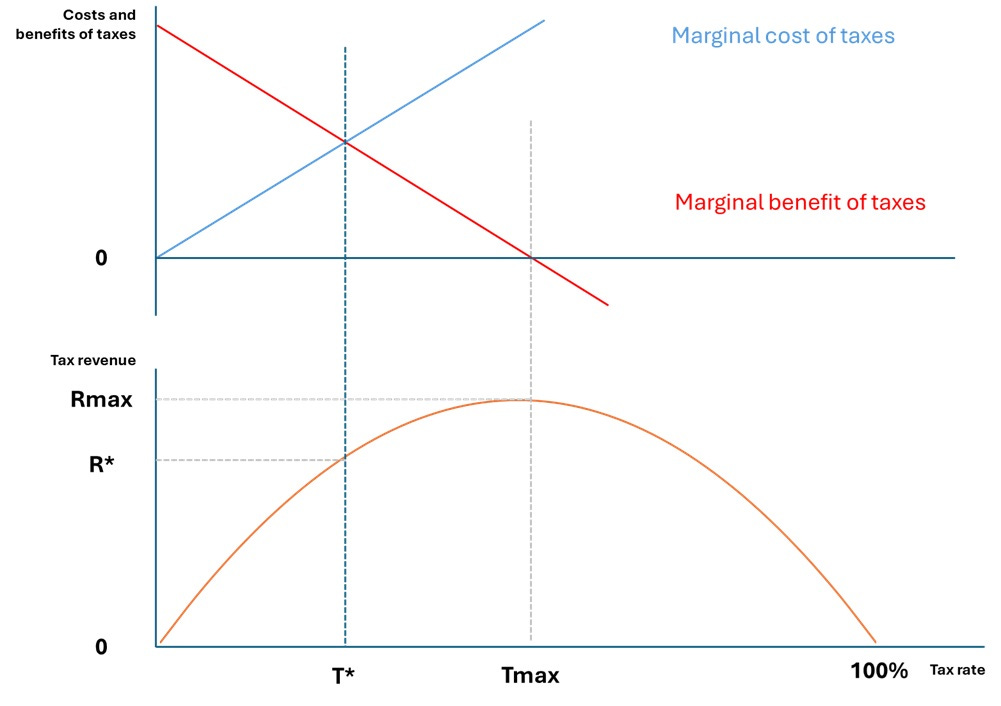
This is how to understand why Tmax is, by a long way, too high a rate, per the chart below, noting:
the optimal tax rate is T* not Tmax;
T* is determined by the shape and slope of the blue and red lines, reflecting the relative valuations of household vs government activity;
because the Laffer Curve is, in fact, a curve, the revenue impact of reducing taxes from Tmax to T* is proportionally smaller than you’d think;
We must discuss the complex trade-offs between value in the private sector and value in the public sector. If instead we’re talking about Laffer Peak, trying to find Tmax like a 16-year-old boy trying to find a you-know-what…we’re fumbling in the wrong place.
For economics students, this chart may be sufficient to make the point, and skip to the conclusion. Otherwise, read on for the full explanation.
The costs of taxation
For any given increase in tax on (for example) work, there are costs, which I’ll explain formally (but briefly) then in plain English. The Laffer Curve does not reflect these costs.
Society loses the entire value of the economic activity destroyed by the tax hike, harming employees, employers and customers as well as the taxman. The Laffer Curve only shows the cost to the taxman; society cares about all the costs.
The private sector (which is, lest anyone forgets, part of society), loses surplus value on the economic activity that still takes place. The surplus was extracted by the taxman. Employers get less profit to reinvest or take as dividends for their own consumption and saving. Employees get less money to consume or save. Depending on the final product market, customers might pay higher prices, which have opportunity costs elsewhere in their spending choices. Those costs do not appear on the Laffer Curve at all.
Both costs are zero at 0% tax, and then increase as higher rates discourage more activity and extract more surplus.
As well as extracting value and destroying economic activity directly, taxes create negative second-and-third order effects via the de-multiplier mechanism, which is simply about opportunity cost, but for some reason (no doubt, entirely innocent and unbiased) nobody ever talks about or teaches. The Keynesian “Free Lunch” public-spending multiplier is taught at A-level; the de-multiplier is simply the equal and opposite mechanism at work in the private sector, and is widely-ignored. Those indirect effects (on customers, employers, employees, and all their various tax contributions) don’t appear in the Laffer Curve either.
Now in plain English:
When you tax workers they do less work and pay less tax (which the Laffer Curve reflects). Unfortunately, the Laffer Curve ignores all the following:
when workers with reduced disposable income cut back consumption of domestic help, eating out, nice meals in, weekends away or extending their house, their life becomes more grey and less exciting, and
that matters in itself; and
it spells doom for armies of cleaners, gardeners, waiters, farm shops, B&Bs, tour guides, and tradesmen, and that matters too; and
those people pay less tax too; and
at worst it matters even more if those people struggle to raise their kids and start claiming benefits;
when the original employers make less profit, they also
pay less tax
reinvest less in the business harming future growth and reducing future taxes;
take less in dividends, on which they pay less tax; and
reduce their own consumption, harming suppliers (tradesmen, waiters etc) that fulfil consumption; and
those suppliers pay less tax;
on the customer side, the activity destroyed means fewer sales and less tax; higher prices on remaining sales mean more tax but less disposable real income, thus displacing other consumption/saving and generating less tax and harming downstream customers’ incentives to work so they pay less tax
when you discourage saving (because all these people that were living well within their means, now aren’t), you limit future growth (reducing future taxes), reduce investment (and reducing current taxes paid by firms supplying production/investment goods and services) and increase old-age dependency;
In the longer-term, you discourage, with your words and your deeds, younger families from investing in their careers and capabilities, limiting future growth (and taxes);
across all the above, loom the deadweight cost of tax collection, enforcement and then spending bureaucracy.
The benefits of taxation
The benefit to society is whatever-the-government-buys using tax revenue, which we can value as the amount of the tax that was extracted, minus the deadweight cost of tax collection and enforcement, plus the value created when the tax is spent “invested”, including the indirect “multiplier” effect. Let’s assume the government doesn’t actually destroy value, for example by building infrastructure that’s not even useful (!) let alone handing money to foreign governments (!!)
Government spending supports a wide range of activities, and we’d like to assume they start with the most useful ones, noting:
at the left-hand-side of our Laffer Curve, it’s not particularly controversial to use those initial taxes to ensure there’s a Land Registry, a justice system, and a defence capability; then to invest in critical infrastructure like nuclear power stations; then to subsidise merit goods like schools’n’hospitals; long before you get onto transferring money from those that work to those that don’t;
in public spending, the “how” comes into play as well as the “what”; if your public health service is terrifically productive and dedicated to the needs of patients, there’s great benefit in paying for it; if instead it’s a wasteful self-licking lollipop that’s great at DEI and bad on actual health outcomes, it’s a strong argument for leaving households with more money to pay their own way.
MR=MC
Uncontroversially, we balance the cost and the benefit at the margin. We’re interested in the marginal cost (MC) and the marginal revenue (MR) generated by the tax; that is, the cost and revenue generated by the “last pound” raised. When MC=MR, it’s as good as it gets. If we keep going and cost exceeds benefit, MC>MR, it’s a mistake. Thus:
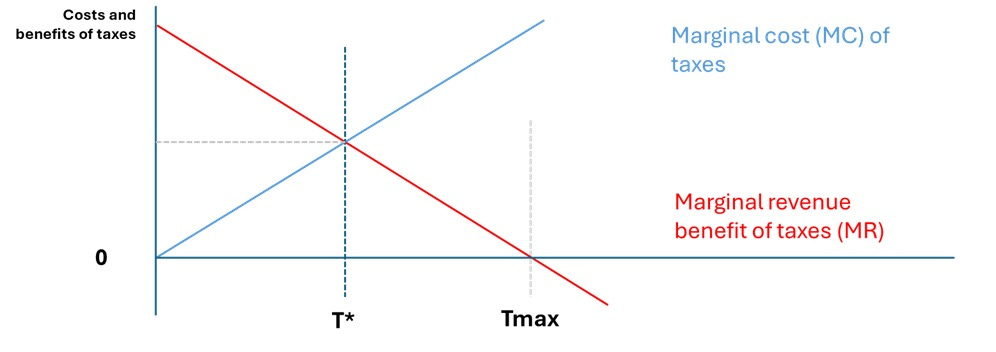
We know MC=0 at 0%. We know MC is increasing with the tax rate because each successive % of tax destroys a larger chunk of value-generating, revenue-supporting activity; moving tax rates from 0% to 1% has virtually no effect on activity, and thus raises almost 1% of what the arithmetic would suggest, in contrast to what the Laffer curve shows around Tmax. We also know that as taxes are increased, the least valuable/profitable activities close down first; the more valuable/profitable activities remain viable (albeit with less surplus) until higher tax rates. So MC is upward-sloping.
We also know that MR=0 at Tmax; and that MR is positive and falling everywhere to the left of Tmax. So MR is downward-sloping.
T*, not Tmax, is society’s optimal rate of taxation. To the right of T*, any further increases in T have more cost than benefit. As I’ve drawn it here, T* is just half the rate of Tmax. That’s just a mathematical peculiarity based on how I chose to draw straight red and blue lines, with one the inverse slope of the other; however it’s also worth highlighting another mathematical peculiarity. If we set taxes at the optimal rate T* instead of the revenue-maximising rate Tmax, the government generates revenue of R* instead of Rmax. But because the Laffer Curve is, indeed, a curve, we saw that the revenue gap (Rmax-R*) is proportionally small compared to the tax cut (Tmax-T*).
To sum up what we know:
T*, not Tmax, is the optimal position for society, balancing the marginal costs and benefits of increasing tax rates;
Marginal Cost (MC) of taxation is zero at 0%, and increasing; Marginal Revenue is zero at Tmax, and decreasing;
T* is determined by the relative slopes of the MC and MR lines;
The revenue effect of reducing tax from Tmax to T* is disproportionately small.
Value-adjusted assessment
We think of the costs and benefits in terms not just of pounds and pence, but value created, captured, transferred and destroyed. The shape and slope of the red and blue lines are debatable, depending what you think of private sector and public sector value creation. If you think government is terrific at creating societal value by spending investing money, then your MR curve might start higher up the X axis, or remain higher for longer, so T* moves right. If you have a high valuation on private sector consumption, saving, investment, growth, or if you think the de-multiplier is very strong, then your MC curve is more steeply upward-sloping, and T* moves left. Those curves might also shift, from society’s perspective, if there are externalities to consider.
In normal-speak, if households are better at spending money than government, then tax rates should be lower. If government is better at spending money than households, then tax rates should be higher. “Better at spending money” means spending it more efficiently and on better things.
Ideally, we’d like to know T*, and therefore we’re interested in the relative position and slope of MC and MR. Clearly this discussion, represented by my arbitrary lines on a chart, skims over a vast range of trade-offs. That’s my point, those are the trade-offs we must discuss. We don’t give a stuff about Tmax.
“Should homeowning households pay for the Land Registry? Should we have income tax so there’s an Army?” You bet.
“Should we extract even more from ‘broad-shouldered families’ earning £75k so that ever greater quantities of anxious people can get a car on Motability and there are unlimited DEI roles in the NHS? Should we just nuke the entire supply side because ‘there exists poverty’ somewhere?” Hmmm…..
Those are interesting questions, and somewhere between the sublime and the ridiculous is a reasonable size and shape of Government, which is found at T* not Tmax.
Subjective valuations and skin-in-the-game
Since private sector exchange is voluntary, we know households valued the extracted surplus and destroyed activity more highly than the pounds and pence raised in tax. Otherwise, they wouldn’t have been doing it. They’d read a book, watch TV, or go for a walk instead.
On the Government side, the value of public spending is not the the tax revenue in pounds and pence, but the value of services delivered; unfortunately there is a risk that value, in the the estimation of some Government official is subject to misleading public choice incentives, colloquially known as “spending other people’s money”. It’s not clear the official’s valuation fairly reflects the opportunity cost - just think about DEI managers and potholes.
People working in Government cannot possibly value the long list of direct and indirect economic costs arising from taxation that we explored, even if they want to, and they quite possibly don’t (because of public choice incentives). Between public choice theory in red, and subjective value in blue, this:
points to households spending money better than government, thus to the blue line being relatively steeper than the red line, and thus to T* moving left;
is exactly why we must force the issue, by rejecting the big-government premise that finding Tmax is remotely worthwhile.
Not just the Resolution Foundation’s cash cow
Debating Tmax lets the high-tax brigade off the hook. It means they aren’t asked to “justify the harms of taxation” . It says we only care about households to the extent they pay tax, we couldn’t care less about their lives, wants, needs or ambitions, and we only perceive value when the government spends it.
Far from creating a “we’re all in it together” society, we’re sharpening the divide between the recipients of government spending, and those who not only pay for it, but (so it seems) have no role in society but to pay for it.
We should only engage in Laffer Curve discussions with counterparts that agree that maximising tax revenue is not the goal. The goal is to support a government of the right size and effectiveness, found and funded at T*. That means taking full account of the costs and benefits, and reflecting the value of households’ freely-chosen work, earning, consumption and saving, as well as their tax contributions.
The goal is a “right-sized” government that serves the country, not itself.
Please share widely and subscribe, it’s free. Thanks for visiting.
I recommend the recent interview with Arthur Laffer on Spectator TV - available on YouTube.
He addresses your macro point because the curve represents tax raised at different levels of taxation and therefore recognises the macro impact as well as the individual disincentives. In fact he advocates much lower levels of taxation in order to promote economic growth as well as a flat tax.
Unlike most academic economists he is highly intelligible (despite being in his 80s) and his theories are grounded in the real world and his maths in genuine statistics.
👏👌🏻Well written & excellent points made. Even made sense to someone as mathematically challenged as myself!